68. BLE and plotting
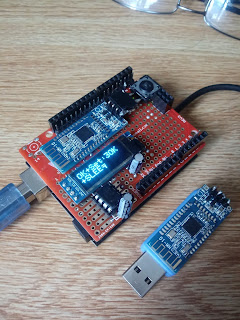
For this project, we will be revisiting the BLE project in which we will be doing the data processing and live to the plot. To do this, we will need to bring back the device that has the various components implanted from the previous such as the heartbeat detector, and the OLED display.
We need to make sure that the code we have for the Arduino is the one that controls the OLED and the Bluetooth module. Not only that, but it also controls the messages when it was read and written for Bluetooth so that they will display on the OLED. For example, when we press the sleep button, the led on the module turns off, and the OLED will display that it's in sleep mode. Only then when you press the button again the module starts to blink and a new message on the OLED says that it's awakened.
 |
| <Subplot> |
Once it works, we now know that the pairing between the Bluetooth transmitter and receiver has been properly set up, and so we need to figure out how we can plot the data in Python. To plot both data with the same figure, we need to use the subplot function, which according to the picture on the right, we use 2 subplots, with one having (2,1,1) for the top, and (2,1,2) for the bottom. These 2 plots are also labeled properly-each with their own title and the axis.
 |
| <Liveplotting> |
To make the data live plotting, we need to have 2 variables, a string of data, and the sampling time. Not only that, you will need to have the animation function in python, which is responsible for making the graph update when it was receiving bits of data every time.
For the figure on the left, you can see that there are 2 subplots because we are sampling 2 data separately, and so we can examine how the 2 data look different.


Comments